On the wide screen of a product launch, the film clearly walks through how Genpilot goes from research needs to analysis results.
Project Type
Brand & Product
Client
BGI Genpilot
Year
2026
Our role
Script structuring, AE UI motion & AI backgrounds
Original format
7680 × 2160 · 01:50
Preview
Click an image to view it full size
BGI GenpilotFilm keyframe · click to enlarge ↗Film01:50 · Film
01 / Background
Helping a launch audience understand a research agent
The launch film for BGI Genpilot had about two minutes to explain how this life-science AI agent works: after a researcher asks a question, how the data is identified, how the task is broken down, how specialist tools are called, and what charts and research reports come out at the end. The audience first needs to see how these steps connect, so the film makes the product interface the star.
The film focuses on real product demos built around two research cases. The first half covers data analysis; the second adds literature and illustrated writing. Both share the same mint-teal palette, and each clearly shows its input, processing and results, so viewers move from abstract capability claims to how the product is actually used.
A 32:9 launch screen offers huge horizontal space, but the audience sits far away and the text has to be legible. The film places short capability lines, product windows and detail close-ups in different parts of the screen, so the topic and the specifics appear together, then uses zooms, highlight boxes and pauses to guide viewers step by step.
02 / Creative Highlights
Organizing complex capabilities into a workflow
01
Two cases to explain different stages of research
The first case runs from data input, identification and task understanding through to tool calls and the results report. The second goes from a research question to loading analysis skills, searching the literature, running the analysis automatically and finally writing the research report. The interface changes with the task, so viewers can see what the product does at each step instead of just remembering a list of feature names.
02
Pulling back on the interface while keeping the capability line
If interface details are zoomed in too far, viewers can't tell which step is being shown, so the explanatory text stays on screen whenever resources are being shown. In the final film, the short line on the left and the interface on the right share the screen, and mint-teal boxes mark the key details. Viewers know which capability is being shown and can see what it corresponds to in the product.
03
Making the report the destination of each workflow
The charts aren't fleeting tech decoration. The report window sits in front with several analysis modules behind it, followed by a summary line that distills the analysis into a readable research result. The results of both cases are presented in a similar way, keeping the pacing of the whole film steady.
04
Research text handled precisely in post-production
The project combines AE motion graphics with AI backgrounds: the interface, text and key highlights are built in AE, and AI-generated content is used only for the moving background. In post, the size of the small text and the dark text color were also standardized. The background gets soft movement, while the fine research details and brand information stay sharp and steady in position.
03 / Scene Breakdown
Two research cases, showing step by step how the product does the work.
Film · 00:00–00:08
Opening: one slogan sums up the product
The DCS Cloud and Genpilot logos appear first, then “Data In, Results Out” sweeps across the frame in large type, merges into one line with “Your AI Research Partner,” and finally resolves into the Genpilot logo.
Clip · 00:00–00:04
Dual-brand reveal, slogan in motion
Two brand logos appear on a pale teal background, then “Data In, Results Out” sweeps diagonally across the lens in large type.
Clip · 00:04–00:08
The slogan resolves into the product logo
The English slogan and “Your AI Research Partner” merge into one line, then gather into Genpilot's spiral logo.
Film · 00:08–00:26
Case 1: Handing the question to Genpilot
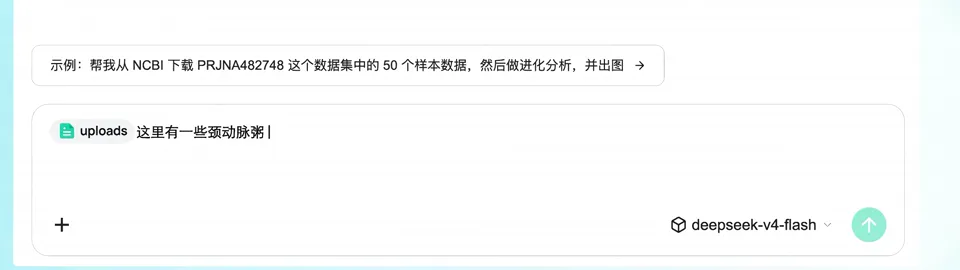
A large number 1 introduces the first case. A researcher asks a question in one sentence of Chinese in the input box, clicks send, and the product first identifies what data has been uploaded.
Clip · 00:08–00:12
The number 1 introduces the first case
“Explore disease mechanisms in depth from complex research data” appears with a large number 1, then the camera pushes in to the product home page, with “Ask research questions in natural language” on the left.
Clip · 00:12–00:18
Typing the question and clicking send
A research question about carotid atherosclerotic plaque is typed character by character into the input box. The cursor moves to the send button and clicks, and a ripple spreads out from the button.
Clip · 00:18–00:26
Automatically identifying the data type
A text card reads “Automatically identifies research data types.” On the right, the product's reply is circled with a mint-teal box, then the view slides to the list of uploaded files.
Film · 00:26–00:43
Case 1: Breaking down the task, allocating compute
The question is broken into steps, and the task progress advances notch by notch. When the data turns out to be too large, the product requests more capacity on its own, then calls specialist tools to continue the analysis.
Clip · 00:26–00:33
Breaking it into an executable path
“Breaks research questions down into executable paths” types out character by character. Then the task progress on the right moves from 2/5 to 4/5, while the left keeps “Makes the research process clearer and more reproducible.”
Clip · 00:33–00:40
From understanding the task to allocating resources
The capability statement is on the left and the run log on the right. Mint-teal boxes first circle “Data 1.65 GB, scale-up needed,” then “Scale-up successful (32 GB / 4 cores).”
Clip · 00:40–00:43
Calling specialist tools on its own
The screen clears, leaving just two lines: it calls specialist tools and matches resources on its own, completing the entire research process from running the analysis to interpreting the results.
Film · 00:43–00:55
Case 1: The report and the conclusion
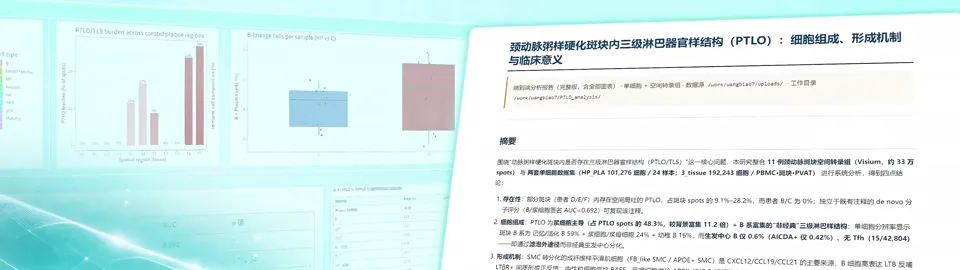
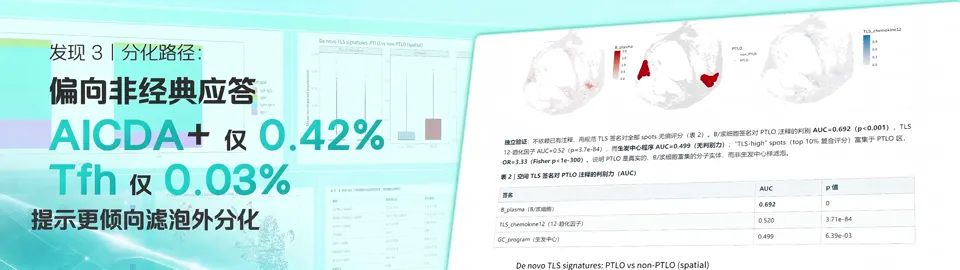
The research report window moves to the front with charts spread out behind it. Key figures are enlarged on the left, ending on a one-line conclusion.
Clip · 00:43–00:51
The report and the enlarged findings
The report title refers to tertiary lymphoid organ-like structures (PTLO) within plaque. On the left, “27,020 spatial spots support the presence of PTLO” and “3 key signals” are enlarged in turn.
Clip · 00:51–00:55
The conclusion of the first case
After a white-out transition, the core conclusion appears: within carotid plaque, immune cells can gather into organized local immune structures, PTLO.
Film · 00:55–01:27
Case 2: Searching literature and data together
A large number 2 introduces the second case: liver cancer research. This time the product doesn't just analyze data. It first searches the literature and builds a literature library before starting the analysis.
Clip · 00:55–01:00
The number 2 introduces the second case
“Uncover new targets for cancer intervention by combining cutting-edge literature and data” comes into focus from a blur, with a large number 2 standing on the right.
Clip · 01:00–01:07
Entering the liver cancer research question
A long request is typed into the input box: search the literature on liver cancer spatial omics, identify regions that promote and inhibit invasion, then click send.
Clip · 01:07–01:16
Loading skills, searching literature
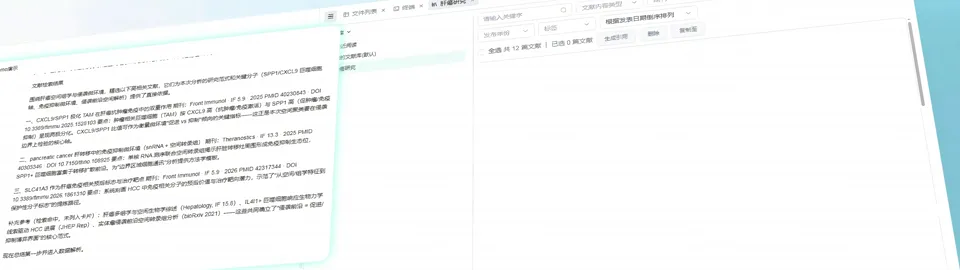
In a tilted interface, the product's replies scroll past section by section. Mint-teal boxes circle “Loading literature search skill” and “Data file confirmed” in turn, and the text card on the left changes along with them.
Clip · 01:16–01:22
The literature library and the analysis kick off
The literature library interface appears layered with the papers it found, with “Starts the analysis workflow and runs the research analysis automatically” on the left.
Clip · 01:22–01:27
Summing up the toolchain in one line
Two lines sum up what the product can do: from reading literature to illustrated writing, Genpilot collaborates all the way.
Film · 01:27–01:50
Case 2: Results and brand end card
The second report closes the same way: report in front, charts behind, three findings enlarged one by one, and finally back to Genpilot and DCS Cloud.
Clip · 01:27–01:34
Spatial evidence and differentially expressed genes
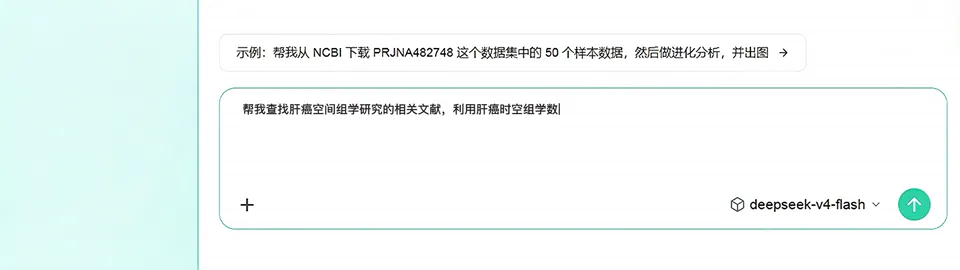
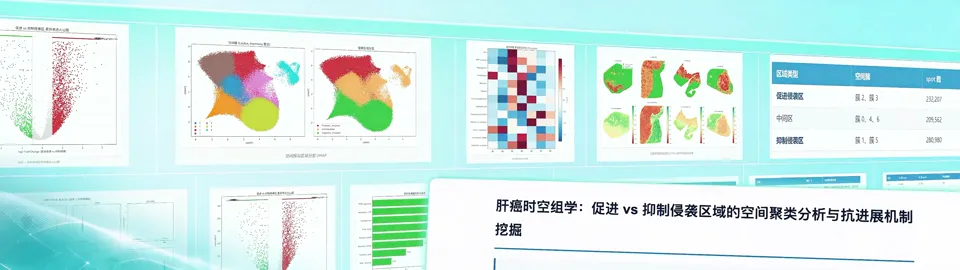
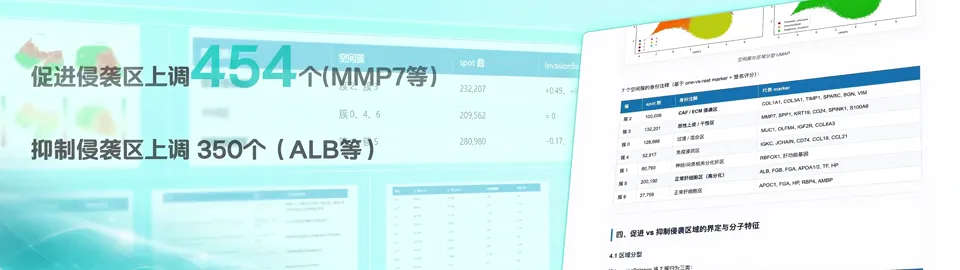
The report window scrolls through a spatiotemporal omics analysis of liver cancer. On the left, “9 liver cancer cases, 723K spatial spots” is enlarged, followed by the counts for two sets of differentially expressed genes.
Clip · 01:34–01:40
The third finding and the heat map
A heat map and a regional table fill the background, while the left states the core mechanism: a metabolic axis plays a protective role, with a discriminative power of AUROC = 0.929.
Clip · 01:40–01:44
The conclusion of the second case
The core conclusion types out character by character: at the liver cancer boundary there is an “invasion-suppressing zone” driven by a differentiated metabolic program, which may inhibit tumor progression.
Clip · 01:44–01:50
Logo animation finale
The Genpilot spiral logo spins out on its own, then settles side by side with DCS Cloud on the end card.
04 / Storyboards & Final Frames
Two research cases: the final frames, shot by shot.
The product interface is the star of this film. Below, shots are listed in the order of the final film: each one explains what it needs to convey and why it is arranged that way, followed by the final 32:9 frame. For the process from design boards to the final film, see “Case Study.”
01
Opening Slogan
In the film · 00:00–00:08
Shot 1.1
Slogan and Product Logo
“Data In, Results Out” first rushes diagonally across the lens in large type, then merges into one line with “Your AI Research Partner,” and finally resolves into the Genpilot logo. Large type and generous white space keep it legible from far away on the wide screen.
Slogan and Product Logo · Final 1Slogan and Product Logo · Final 2Slogan and Product Logo · Final 3
02
Case 1: Asking the Question
In the film · 00:08–00:26
Shot 2.1
Title of the First Case
A two-line bold title with a large number 1 tells viewers at a glance that this is the first case. The heavy font weight keeps it readable even from the back rows.
Title of the First Case · Final 1
Shot 2.2
Stating the Need in One Sentence of Chinese
The left reads “Ask research questions in natural language,” and the right shows the product home page. The camera then pushes in to the input box so the typed question can be read clearly.
Stating the Need in One Sentence of Chinese · Final 1Stating the Need in One Sentence of Chinese · Final 2
Shot 2.3
Clicking Send
The camera moves close to the send button. The cursor clicks, and a ripple spreads out from the button, showing that the question has been submitted.
Clicking Send · Final 1
Shot 2.4
Automatically identifying the data type
A text card on the left explains the capability, while the right shows how the product identified the uploaded data. The view then pulls to the file list, revealing a batch of real research data.
Automatically identifying the data type · Final 1Automatically identifying the data type · Final 2
03
Case 1: Breakdown, Allocation and Results
In the film · 00:26–00:56
Shot 3.1
Breaking It into Executable Paths
A single sentence fills the screen: the first half in dark grey, with “executable paths” highlighted in the brand's teal-green.
Breaking It into Executable Paths · Final 1
Shot 3.2
Task Progress
The task progress card from the product is shown on its own, with checklist items lighting up one by one so viewers can see the research advancing step by step.
Task Progress · Final 1
Shot 3.3
From understanding the task to allocating resources
Text on the left, interface on the right, with thin mint-teal boxes circling the key lines in the run log. The explanation on the left is set in two bold lines and stays on screen while resources are shown, so viewers always know which step is being discussed.
From understanding the task to allocating resources · Final 1
Shot 3.4
Calling specialist tools on its own
The line “Calls specialist tools on its own” is made into a two-line text animation, with keywords highlighted in teal-green so it can be read at a glance from far away.
Calling specialist tools on its own · Final 1
Shot 3.5
The Report and Key Figures
The report window sits in front with charts behind it. The findings are split into “Finding 1, Finding 2,” and key figures, such as “27,020 spatial spots,” are enlarged on the left.
The Report and Key Figures · Final 1
04
Case 2: Literature and Data
In the film · 00:56–01:28
Shot 4.1
Title of the Second Case
It uses the same bold layout as Case 1, paired with a large number 2, so the two cases mirror each other.
Title of the Second Case · Final 1
Shot 4.2
Entering the liver cancer research question
The input box sits in the center of the frame, the entire request is fully legible, and the cursor rests on the send button.
Entering the liver cancer research question · Final 1
Shot 4.3
Searching and Verifying Data
The interface scrolls at a tilt while mint-teal boxes circle what the product is doing at each step, matching the highlighting style of Case 1.
Searching and Verifying Data · Final 1
Shot 4.4
Summing up the toolchain in one line
Tools such as “literature reading” and “illustrated writing” are written as a two-line text animation, with keywords highlighted in teal-green.
Summing up the toolchain in one line · Final 1
05 / Results
A widescreen deliverable for a product launch
On September 8, 2026, the project delivered a 7680×2160, 32:9 widescreen promo video for playback at the product launch.
Case Study
Liandan AI Studio × BGI Genpilot | Helping an audience understand a research agent on a 32:9 widescreen
A researcher asks one question, and the AI agent goes off to identify the data, allocate compute, run the analysis and write the report.
It sounds simple. Putting it on a big launch screen so the audience understands it within two minutes is not.
This is our work for BGI Genpilot — a product launch film running 1 min 50 s in 7680×2160, 32:9 widescreen. Using two real research cases, it walks the product all the way from “asking a question” to “delivering a report.”
Client
BGI · Genpilot (life-science AI agent, DCS Cloud platform)
Project Type
AI product launch film / Product demo video
Timeline
Kicked off August 24, 2026; delivered September 8
Runtime & Specs
1 min 50 s, 7680×2160 (32:9 widescreen)
Distribution
Played live at the product launch in September 2026
Production Method
AE interface and text animation + AI motion backgrounds
Produced by
Shenzhen Alchemy Technology Co., Ltd. (Liandan AI Studio)
01
Rather than listing features, let the audience watch it do the work once
Genpilot is an AI agent for the life sciences: ask a research question in natural language, and it plans the tasks, calls compute and analysis tools, draws research charts and writes research reports on its own.
If these capabilities were listed as a string of nouns, viewers would come away remembering only that it's “impressive,” without being able to say what it can actually do for them.
The client wanted the film to focus on the product itself and provided two real research cases. So we had the film follow these two cases: Ask a question → Identify the data → Break down the task → Allocate resources → Reach a conclusion.
The first case studies immune structures in carotid plaque; the second studies invasive regions at the liver cancer boundary. Each case opens with a large number, so viewers always know which section they're watching.
Case 1: opening with a large number 1Case 2: the same layout, with the number 2
02
The screen is wide, but the back rows still need to read the text
A 32:9 launch screen offers huge horizontal space, but the audience sits far away. The text in a product interface is small to begin with; put it up as is, and the audience sees only a blur of white.
We set one fixed layout for the whole film: a one-line capability statement on the left, the product interface on the right. The statement tells viewers which step is being shown, and the interface shows what that step really looks like.
During revisions we made several specific changes: interface details that were zoomed in too far were pulled back so viewers could tell which page they were on; explanatory text stayed on screen while resources were shown; key lines that needed reading were circled with the same thin mint-teal box; and all on-screen text was switched to BGI's brand typeface, using only dark grey and teal-green.
Clip · 00:33–00:40
From understanding the task to allocating resources
The explanation on the left holds still while key lines in the run log on the right are circled in mint teal one after another.
03
The real interface has to be exact; the background goes to AI
This is a product demo film. Every word and every number in the interface has to match the real product, so AI can't be allowed to “draw” it.
So we split the work in two: the product interface, text, cursor clicks and highlight boxes were all built in AE as animations with alpha channels; AI only generates the flowing mint-teal background, which we curated and laid underneath. At the design-board stage, green blocks held the place of the interface screen recordings; once the composition was approved, the real interface was composited in.
Design board: green blocks as placeholders for interface recordingsFinal film: real interface composited in, key lines circled in teal
Before delivery, we checked the small text section by section. Wherever processing left it less than sharp, we rebuilt it in AE, so the terms and figures in the reports remain readable on the big screen.
04
Each case lands on a readable report
What researchers care about most is what they get in the end.
In the design boards, the report window closed with just one line of explanation. The client wanted richer endings for both cases, so we split the findings in each report into “Finding 1, Finding 2, Finding 3,” enlarged the key figures on the left of the frame, and spelled out the core conclusion in one sentence.
Design board: report window with one line of explanationFinal film: findings enlarged one by one, key figures highlighted on their own
Both cases close the same way: report in front, charts behind, figures enlarged, conclusion in text. The second time around, viewers already know how to read it, and the pacing is steadier.
Clip · 01:27–01:34
Findings from Case 2
The report scrolls in the foreground, while “9 liver cancer cases, 723K spatial spots” and the counts of differentially expressed genes are enlarged on the left.
05
Turning complex animation into one easy-to-read line
The film has two lines that sum up the product's capabilities. In the design boards, they were given a graphic animation: lines extend from the logo and connect to a series of keyword bubbles.
On the big screen, the text in the bubbles was too small and the lines were distracting. The client wanted the two lines themselves to be easier to read, so we turned them into clean two-line text animations, with keywords highlighted in teal-green.
Design board: the logo connected to four keyword bubblesFinal film: two lines of text, readable at a glance from far away
06
What this project achieved
Launch videos for tech products easily end up as a feature list with flashy effects. Viewers find them lively but come away not knowing how the product is used.
This film took a different approach: demonstrate with real cases, let the real interface do the talking, and set the type for the viewing distance of a big screen. From kickoff on August 24 to delivery on September 8, in 16 days we turned two complete research workflows into a 1 min 50 s widescreen film.
What the audience finally sees is Genpilot genuinely completing two research tasks: from a single question to a readable report.
Clip · 01:44–01:50
Brand End Card
The Genpilot logo spins out, then settles side by side with DCS Cloud on the end card.
FAQ
FAQ
How can an AI product promo explain complex features clearly?
Instead of listing features, this film walks the product through two real research cases from start to finish: asking a question, identifying data, breaking down the task, allocating compute and reaching a conclusion. Each step pairs a one-line explanation on the left with a screen of the real interface on the right, so viewers can see exactly what the product does at each step.
Will AI get the product interface and text wrong?
No. The interface, text, cursor clicks and highlight boxes were all built in AE and match the real product; AI only generated the mint-teal motion background. All on-screen text uses the client's brand typeface, and before delivery we checked section by section that the small text was clear.
How do you make an ultra-wide 32:9 video?
Design every shot for the 32:9 frame: capability statements on the left, the product interface on the right, key lines circled with a consistent highlight box, and any interface zoomed in too far pulled back so it stays legible from a distance. The final delivery was a 7680×2160 widescreen film for playback at the launch.
How long did a film like this take from brief to delivery?
The BGI Genpilot film kicked off on August 24, 2026 and was delivered on September 8, 16 days in total. During that time, we reworked the script around the cases the client provided and made several rounds of detailed revisions for the big-screen viewing experience.
Approach
Precise interfaces and AI backgrounds, made separately
The project combines AE and AI video: the product interface, text and chart animations are rendered with alpha channels and then composited, while curated AI motion backgrounds bring movement to the space of the frame. Anything that must be precise is done in AE; the backgrounds that set the mood are left to AI.
To keep everything legible on site, several specific treatments were applied: interface details pulled back, a single style for highlight boxes, explanatory text kept on screen while resources are shown, and small text unified in size and color. The report always occupies the most prominent position, the surrounding analysis modules show where the conclusions come from, and the film closes on the brand end card.